Detecting Over 160 Anomalies in Minutes
A commercial facilities manager needed an effective way to identify issues across their rooftop PV system. SterFlies’ thermal drone inspection revealed over 160 anomalies—including multi-diode issues— within minutes of arrival.
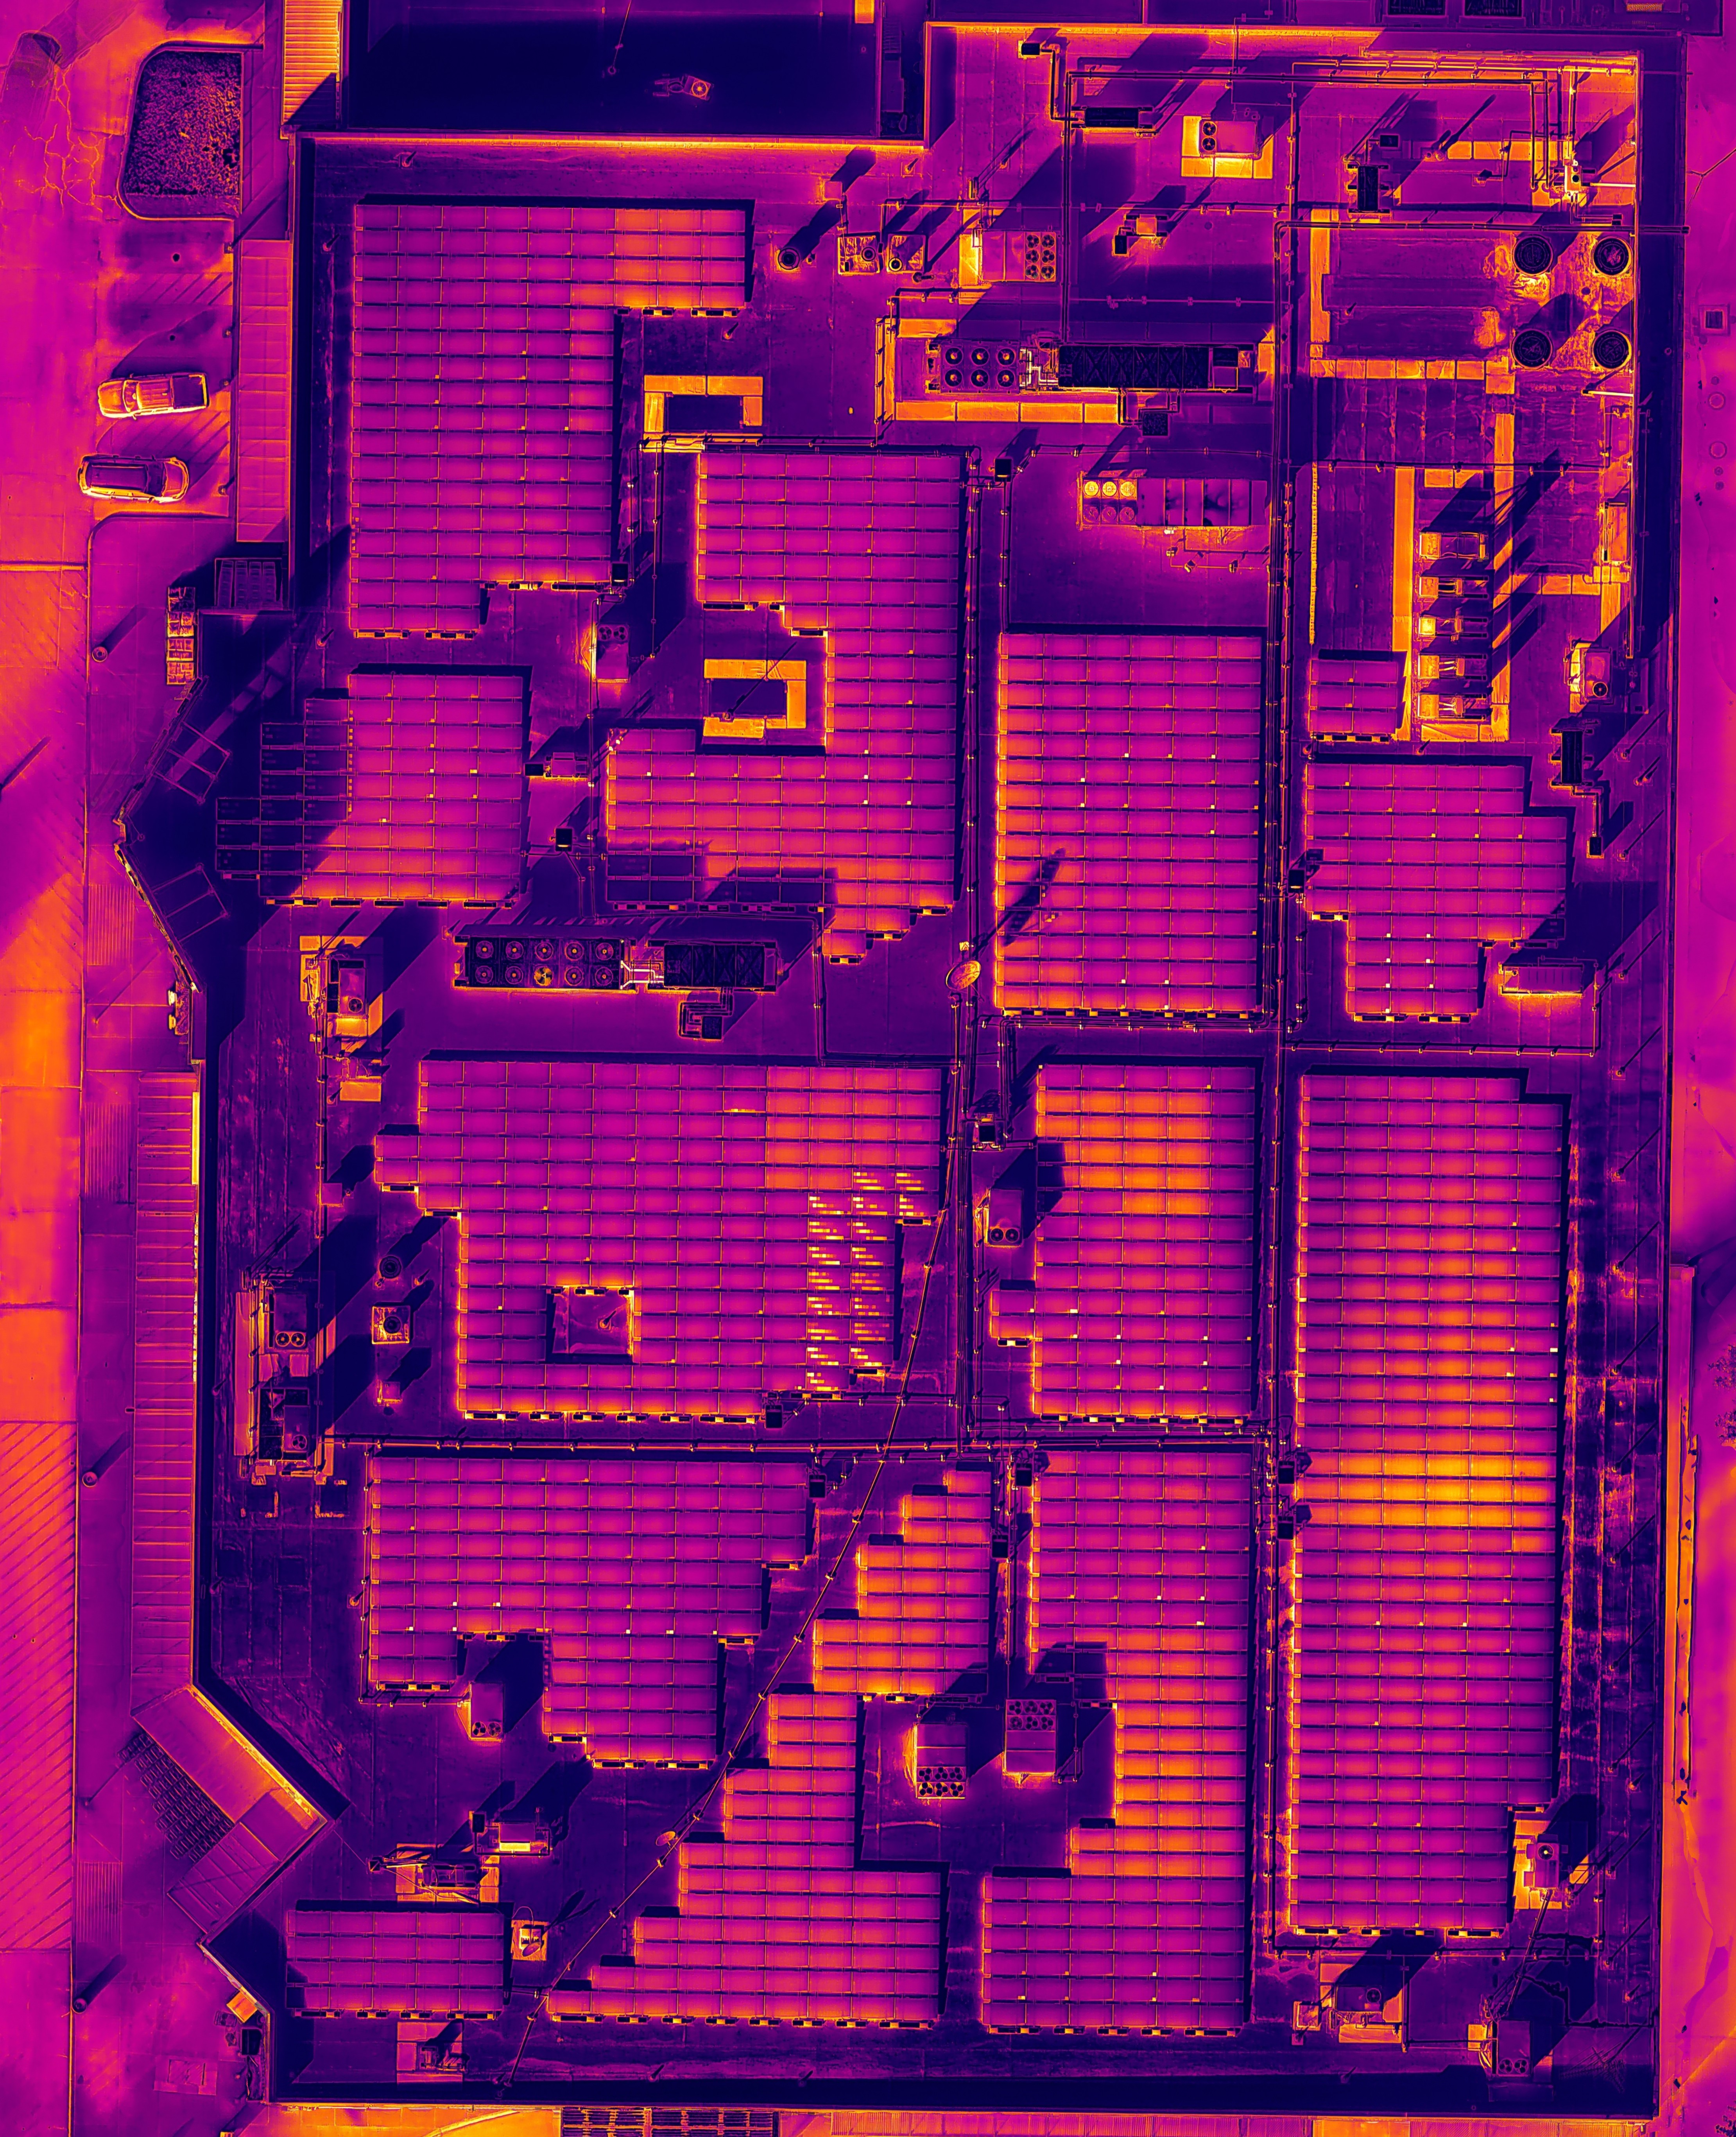
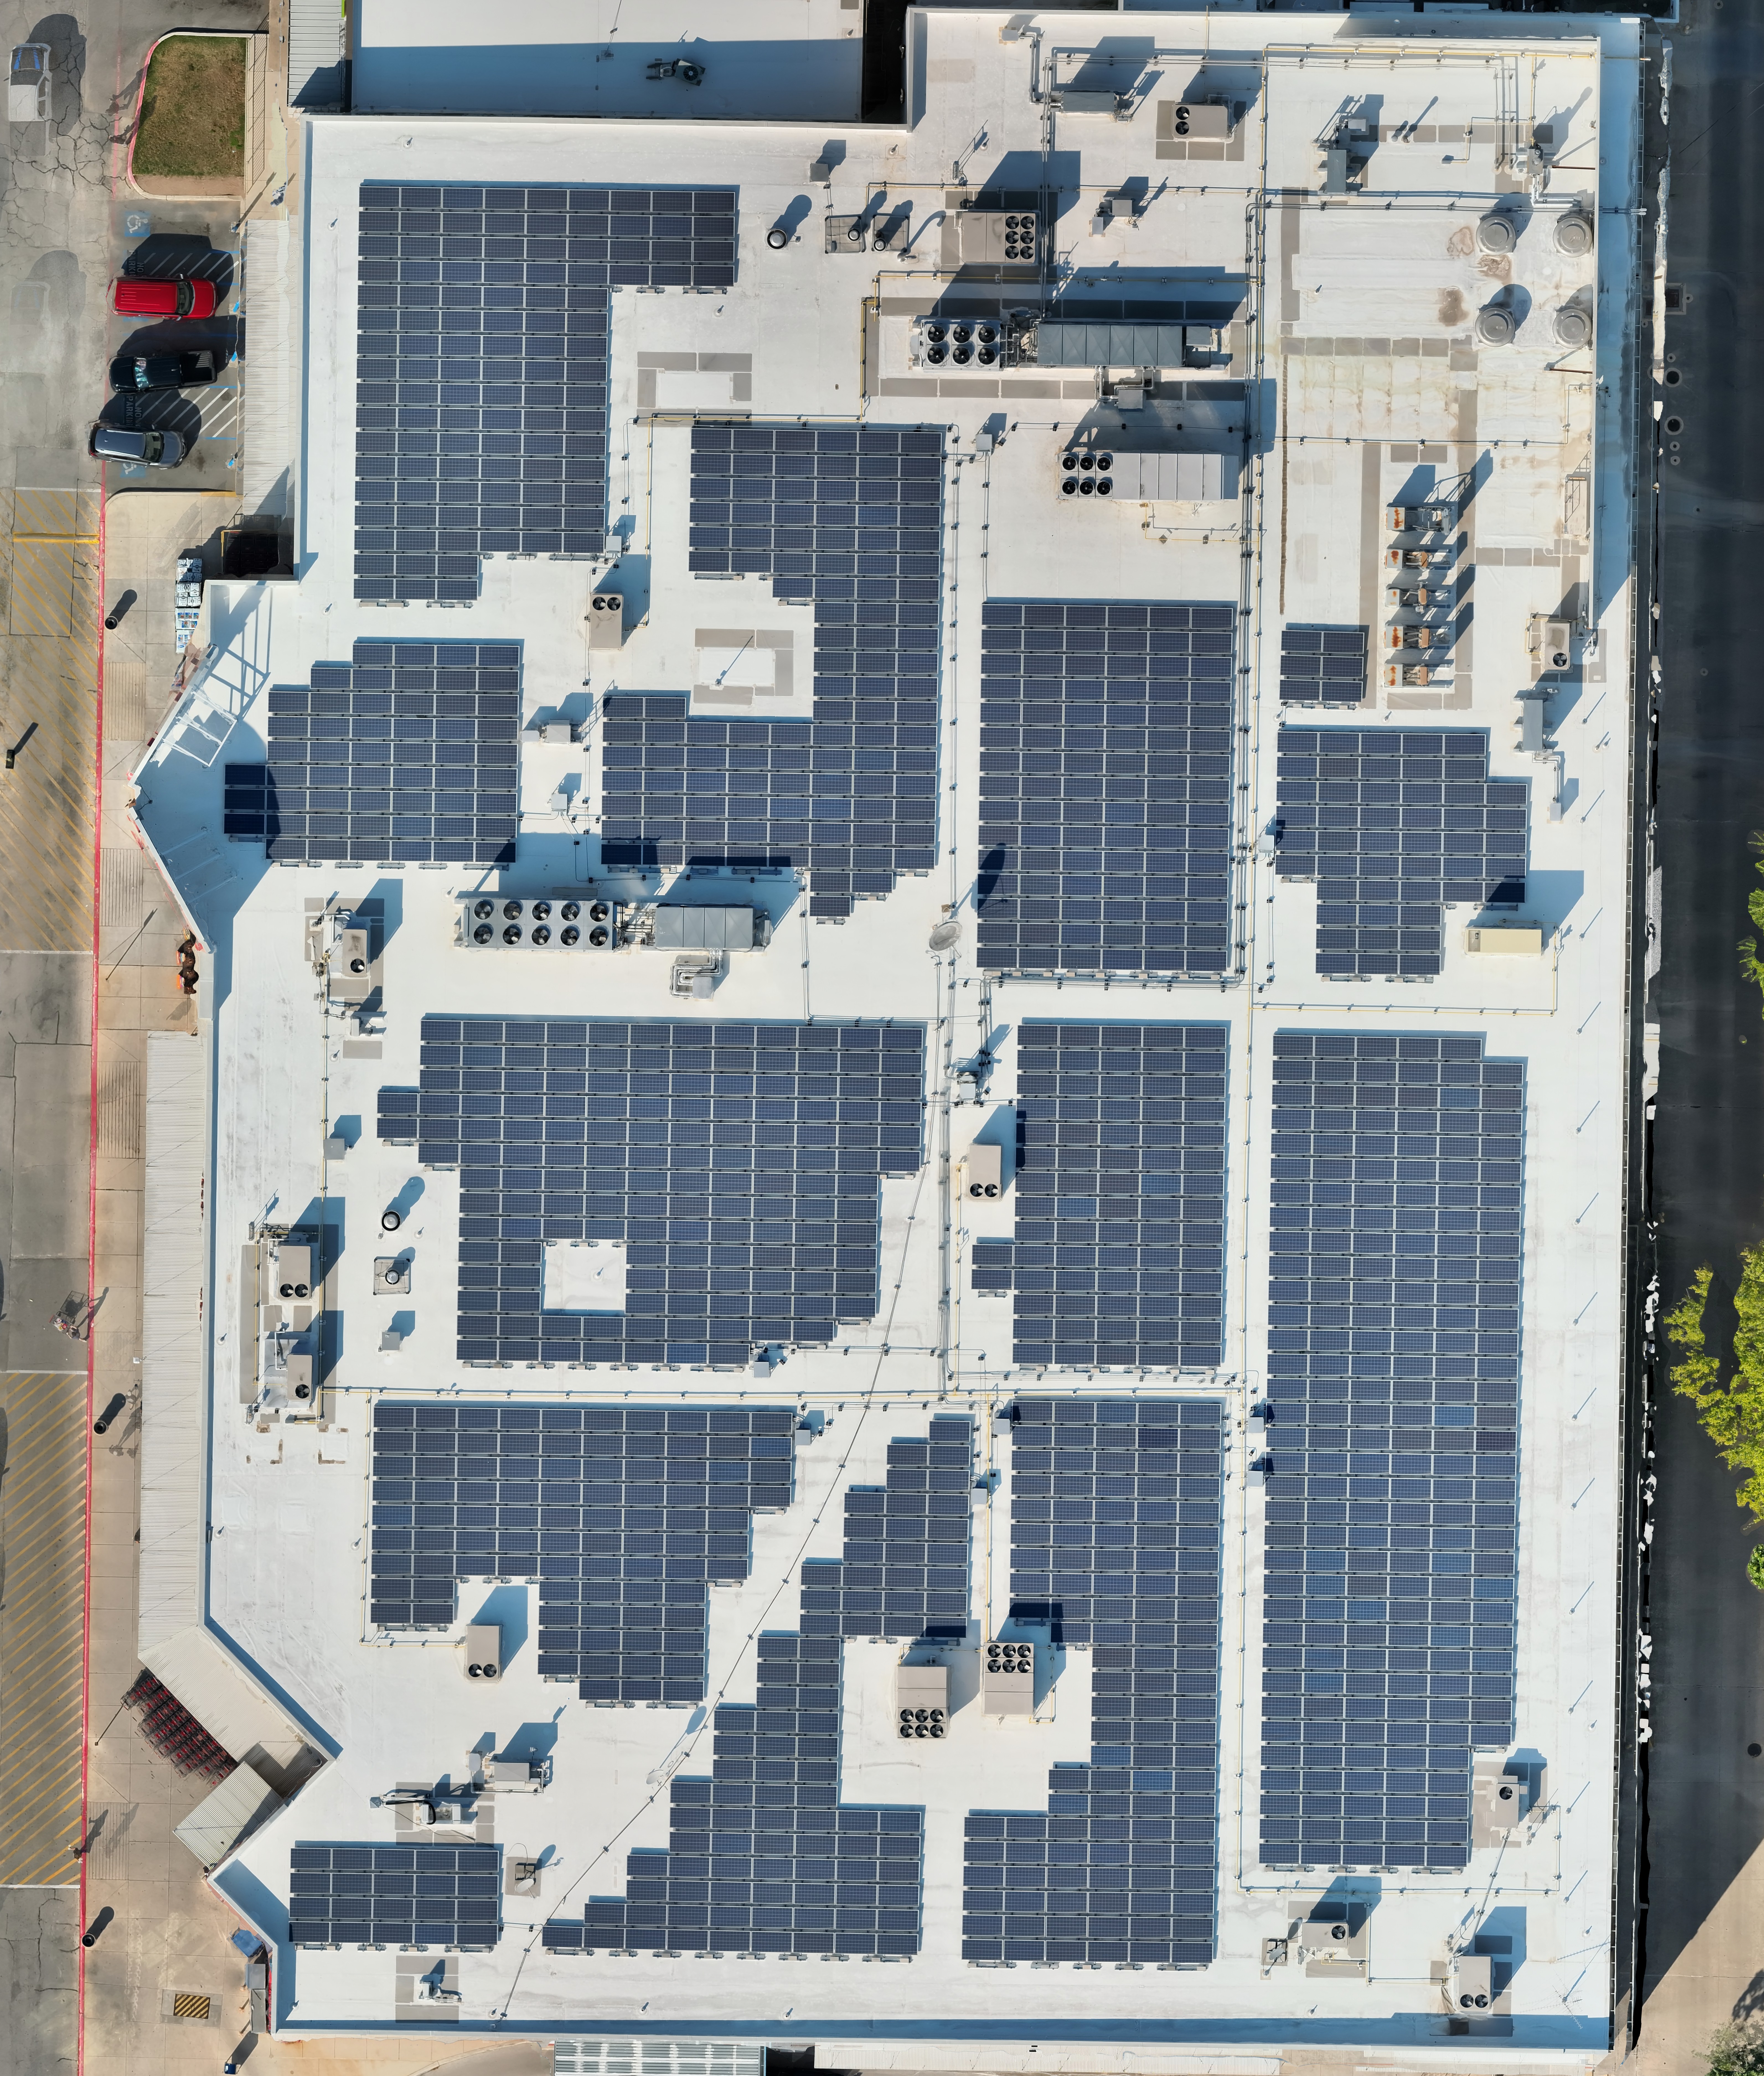
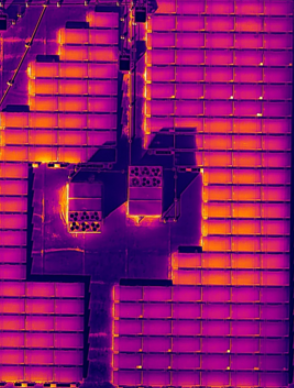
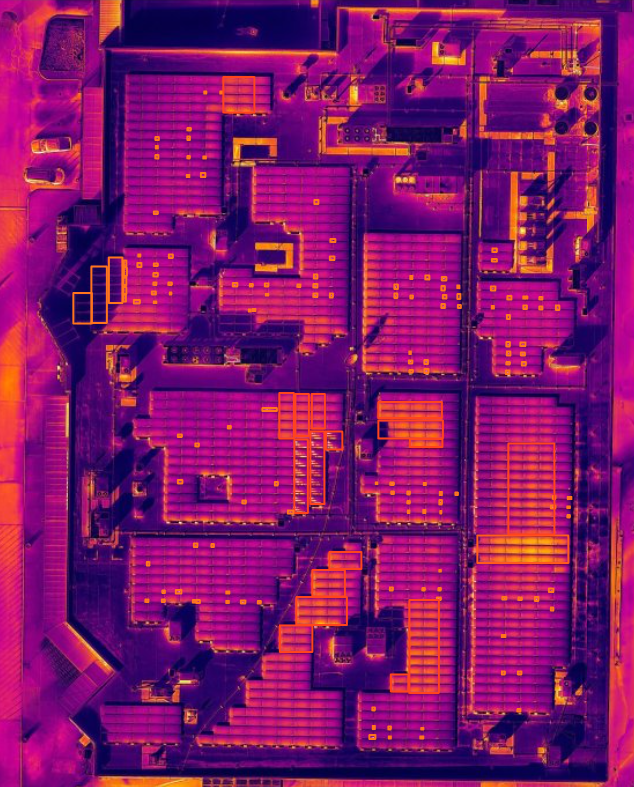
Thermal ↔ RGB Compare
Slide to compare the thermal orthomosaic against the RGB (visual) context. This makes it easy to see how heat signatures align with physical features on the roof—without walking every row.
Problem → Solution: What We Found
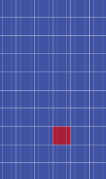
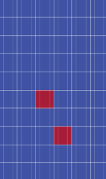
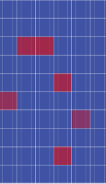
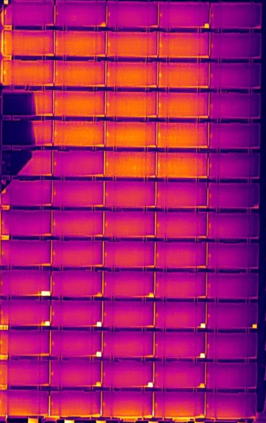
Hotspots & Multi-Hotspots
Single-Hotspots indicate overheating in individual cells or modules. Multi-hotspots amplify this risk, pointing to widespread stress. With drones, these are detected instantly across the roof.
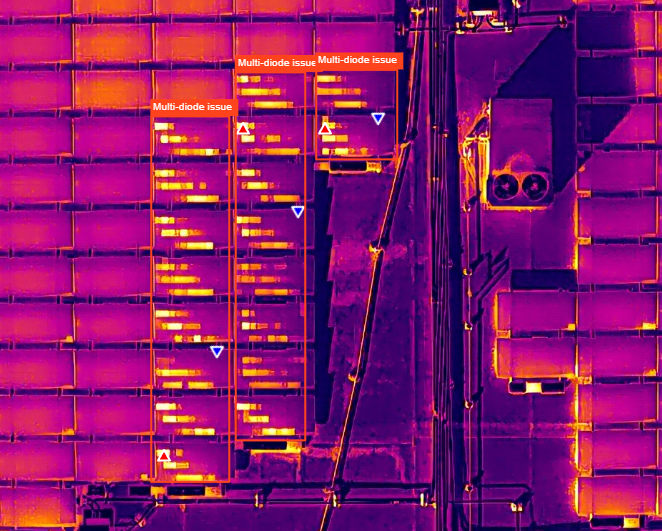
Multi-Diode Issues (Severity 4)
One of the most severe findings was multiple panels with multi-diode failures. This creates significant production loss and poses long-term risks. Highlighting these high-severity issues allowed the facilities team to prioritize repairs.
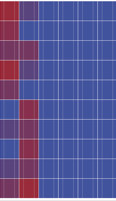
String Anomaly
In PV terminology, if multiple modules in the same electrical string are behaving abnormally, it usually indicates a string-level electrical issue: a faulty inverter, a damaged combiner box, or wiring problems. Identifying these string anomalies helps target systemic issues that affect multiple panels. Uneven heating across a string can lead to significant energy loss and increased wear on the system.
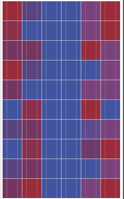
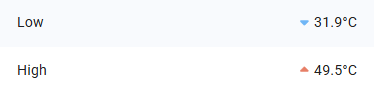
Temperature Spread Matters
The difference between the highest and lowest module temperatures (ΔT) tells a deeper story. Large deltas surface true outliers and point to electrical or physical faults—not just normal variation.
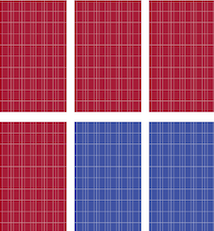
Severity 4 Focus: Multi-Diode Issues & Temperature Spread
A cluster of multi-diode issues was identified across multiple panels—repeatable hot blocks within modules that correlate with measurable production loss. To prioritize action, we measured the temperature spread (ΔT) between the warmest and coolest nearby modules under the same conditions—larger ΔT highlights outliers that deserve immediate attention.
Problem → Solution
- Problem: Over 160 anomalies across a large rooftop PV system, including multiple multi-diode issues.
- Solution: Thermal mapping flags all occurrences at once in minutes, records by ΔT, and geo-tags each panel for fast on-roof verification. Warranty claims are simplified with clear documentation.
- Why ΔT matters: A larger ΔT between modules under the same conditions indicates a true outlier, helping prioritize the most critical issues. In this case, we found ΔT values exceeding 20°C, signaling significant performance loss and risk.
- Next steps: Prioritize Severity 4 panels for immediate testing/replacement; schedule a follow-up mini-scan to confirm remediation.
Thankfully,
We identified 160+ anomalies within minutes of arriving on site and generated a inspection report 24hrs post flight, in accordance with IEC 62446-3 guidelines. Critical defects—including multi-diode failures—were surfaced for immediate attention, giving the facilities manager clear, actionable next steps and protecting long-term performance.
Need clear answers from your PV system?
We uncover hidden issues quickly and deliver reports that highlight what matters most.