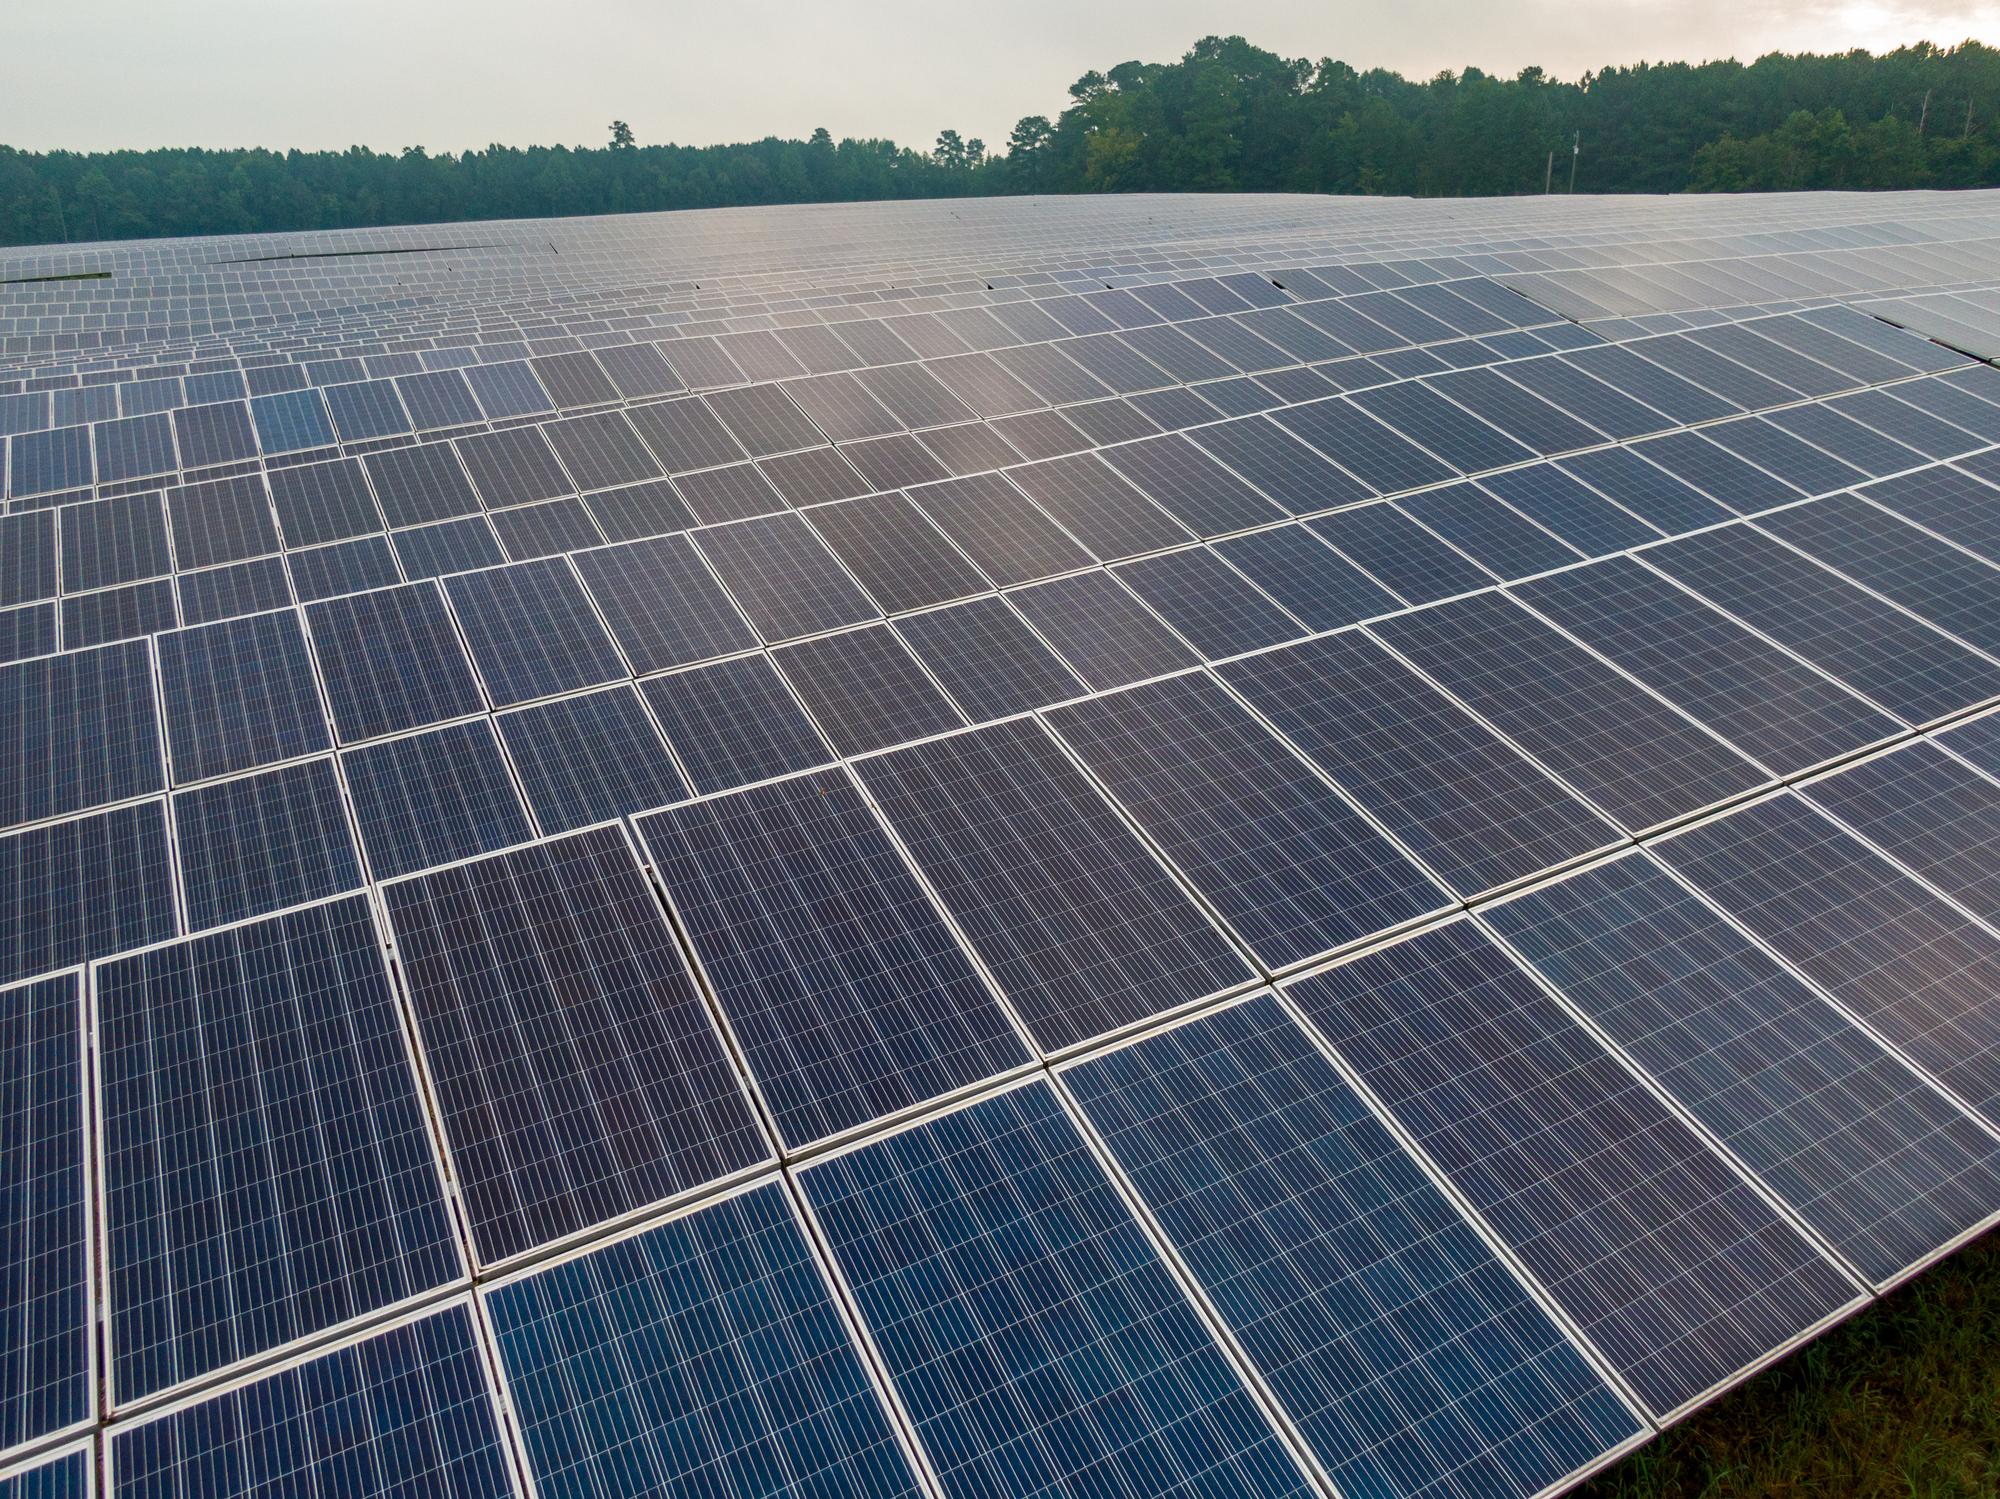
How thermal imaging reveals electrical inefficiency
Photovoltaic modules convert irradiance into direct current through semiconductor cells. Under normal operating conditions, current flows evenly through cells and strings. When a defect increases resistance or creates current mismatch, the system still attempts to move current through the pathway. The excess energy is dissipated as heat. Infrared thermography measures that emitted heat and displays temperature variation across modules, strings, and components.
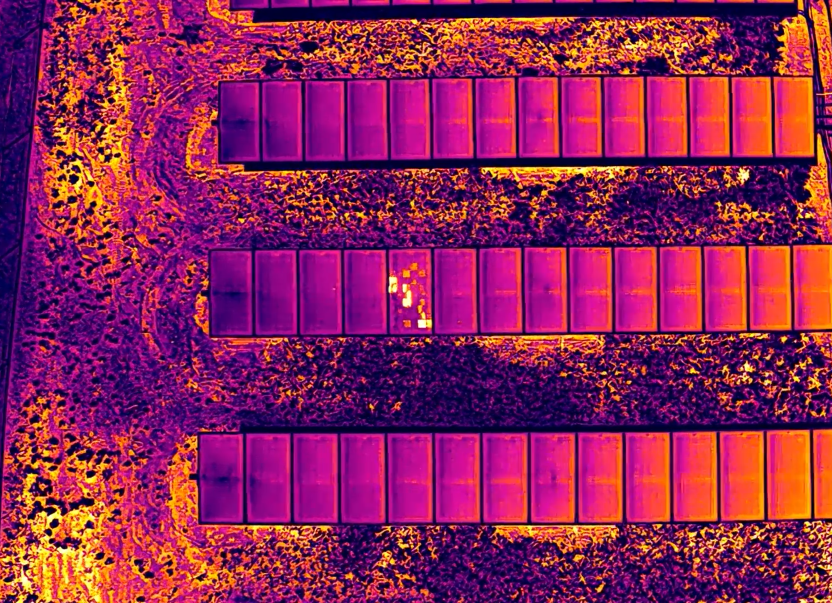
The most important concept in solar thermography is not the color palette. It is the temperature delta, often described as a temperature spread, between an anomalous area and comparable surrounding modules operating under the same conditions. A warm pixel means little in isolation. A meaningful anomaly is a measurable outlier relative to a stable baseline in the same array block, captured under adequate load.
Because thermal readings are influenced by environmental variables, professional inspections are timed and executed deliberately. Modules need sufficient irradiance and load for defects to present clearly. High winds can cool surfaces and reduce contrast. Intermittent cloud cover can suppress load and hide abnormalities. Angle of view, reflections, and camera settings also affect interpretation, which is why consistent methodology matters as much as the camera itself.
Hotspots and multi-hotspots
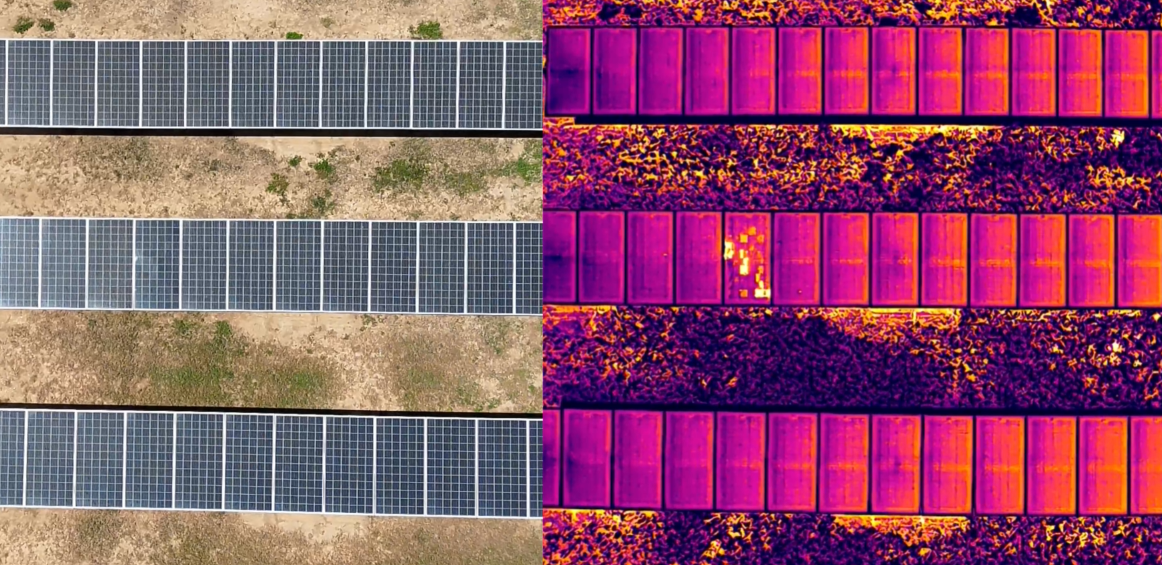
A hotspot is a localized area of elevated temperature within a module. In practical terms, it is a sign that a portion of the module is dissipating more energy as heat than it should. Common underlying causes include microcracks from mechanical stress, manufacturing defects, partial shading, uneven soiling, cell mismatch, and localized damage that alters current flow through one or more cells.
Hotspots matter because they are not just a performance issue. Over time, persistent elevated temperature accelerates material degradation. Encapsulant can discolor, backsheets can deteriorate, and affected regions may become more fragile. In more severe scenarios, sustained overheating increases fire exposure risk and can contribute to premature module failure.
Multi-hotspot behavior refers to patterns where multiple distinct hot areas appear within the same module or repeat across a localized zone. That pattern typically indicates broader internal stress rather than a single isolated cell defect. When hotspots cluster or repeat, they are more likely to be tied to substring behavior, diode stress, or systemic mismatch. Multi-hotspot modules are often higher priority because they correlate more strongly with measurable production loss and accelerated aging.
Bypass diode failure and multi-diode issues
Bypass diodes protect modules from reverse bias conditions when shading or mismatch occurs. When a diode fails, current is no longer redirected effectively around a stressed cell substring. That can cause an entire portion of the module to operate abnormally and generate heat. In thermal imagery, diode-related anomalies often present as distinct linear bands or repeating hot blocks consistent with substring layout.
Multi-diode issues, where more than one diode is compromised, are particularly costly because a larger fraction of the module is affected. These failures can reduce output significantly, contribute to string imbalance, and increase stress on connected components. Because standard monitoring may not isolate a diode fault cleanly, thermography is often the fastest way to identify suspect modules at scale.
The business impact is straightforward. A diode defect is rarely a one-day event. It is commonly a sustained underperformance condition. If left unaddressed, it becomes a predictable source of lost kilowatt-hours across the time window between inspections.
Potential induced degradation and voltage-driven performance loss
Potential induced degradation, often referred to as PID, describes efficiency loss driven by voltage potential differences that can create leakage currents within modules. PID is important because it tends to appear as a system-level or string-level phenomenon rather than a single isolated defect. If it progresses, it can reduce efficiency across meaningful portions of an array.
Thermally, PID may present as broader warming patterns, edge-oriented behavior, or consistent anomalies across groups of modules. The exact appearance can vary depending on module design and operating conditions, which is why thermal inspection should be paired with good operational context and targeted electrical testing when PID is suspected.
The financial risk of PID is scale. When a defect pattern affects dozens of modules in a string or inverter block, the production impact is no longer minor. Early detection and mitigation can prevent long-term loss from compounding and reduce the likelihood of larger warranty and performance disputes.
String-level anomalies and systemic imbalance patterns
Some anomalies are not rooted in a single module. They are rooted in how multiple modules are connected. A string-level anomaly is a thermal pattern that suggests a systemic issue affecting a row, string, or inverter block. Instead of one module standing out, multiple modules may appear uniformly elevated or reveal a repeating pattern that aligns with electrical topology.
These patterns can indicate wiring resistance, fuse and combiner behavior, inverter channel imbalance, or broader mismatch driven by installation variables. The advantage of drone mapping is that it reveals patterns that are hard to see on foot. If you only look at individual images, you can miss the fact that the same anomaly is repeating across a string. A site-wide thermal view makes that structure obvious.
When string-level patterns appear, they typically justify deeper diagnostics, such as targeted string testing, I-V curve tracing, or electrical connection review. Thermography is the screening tool that tells you where to spend time and labor.
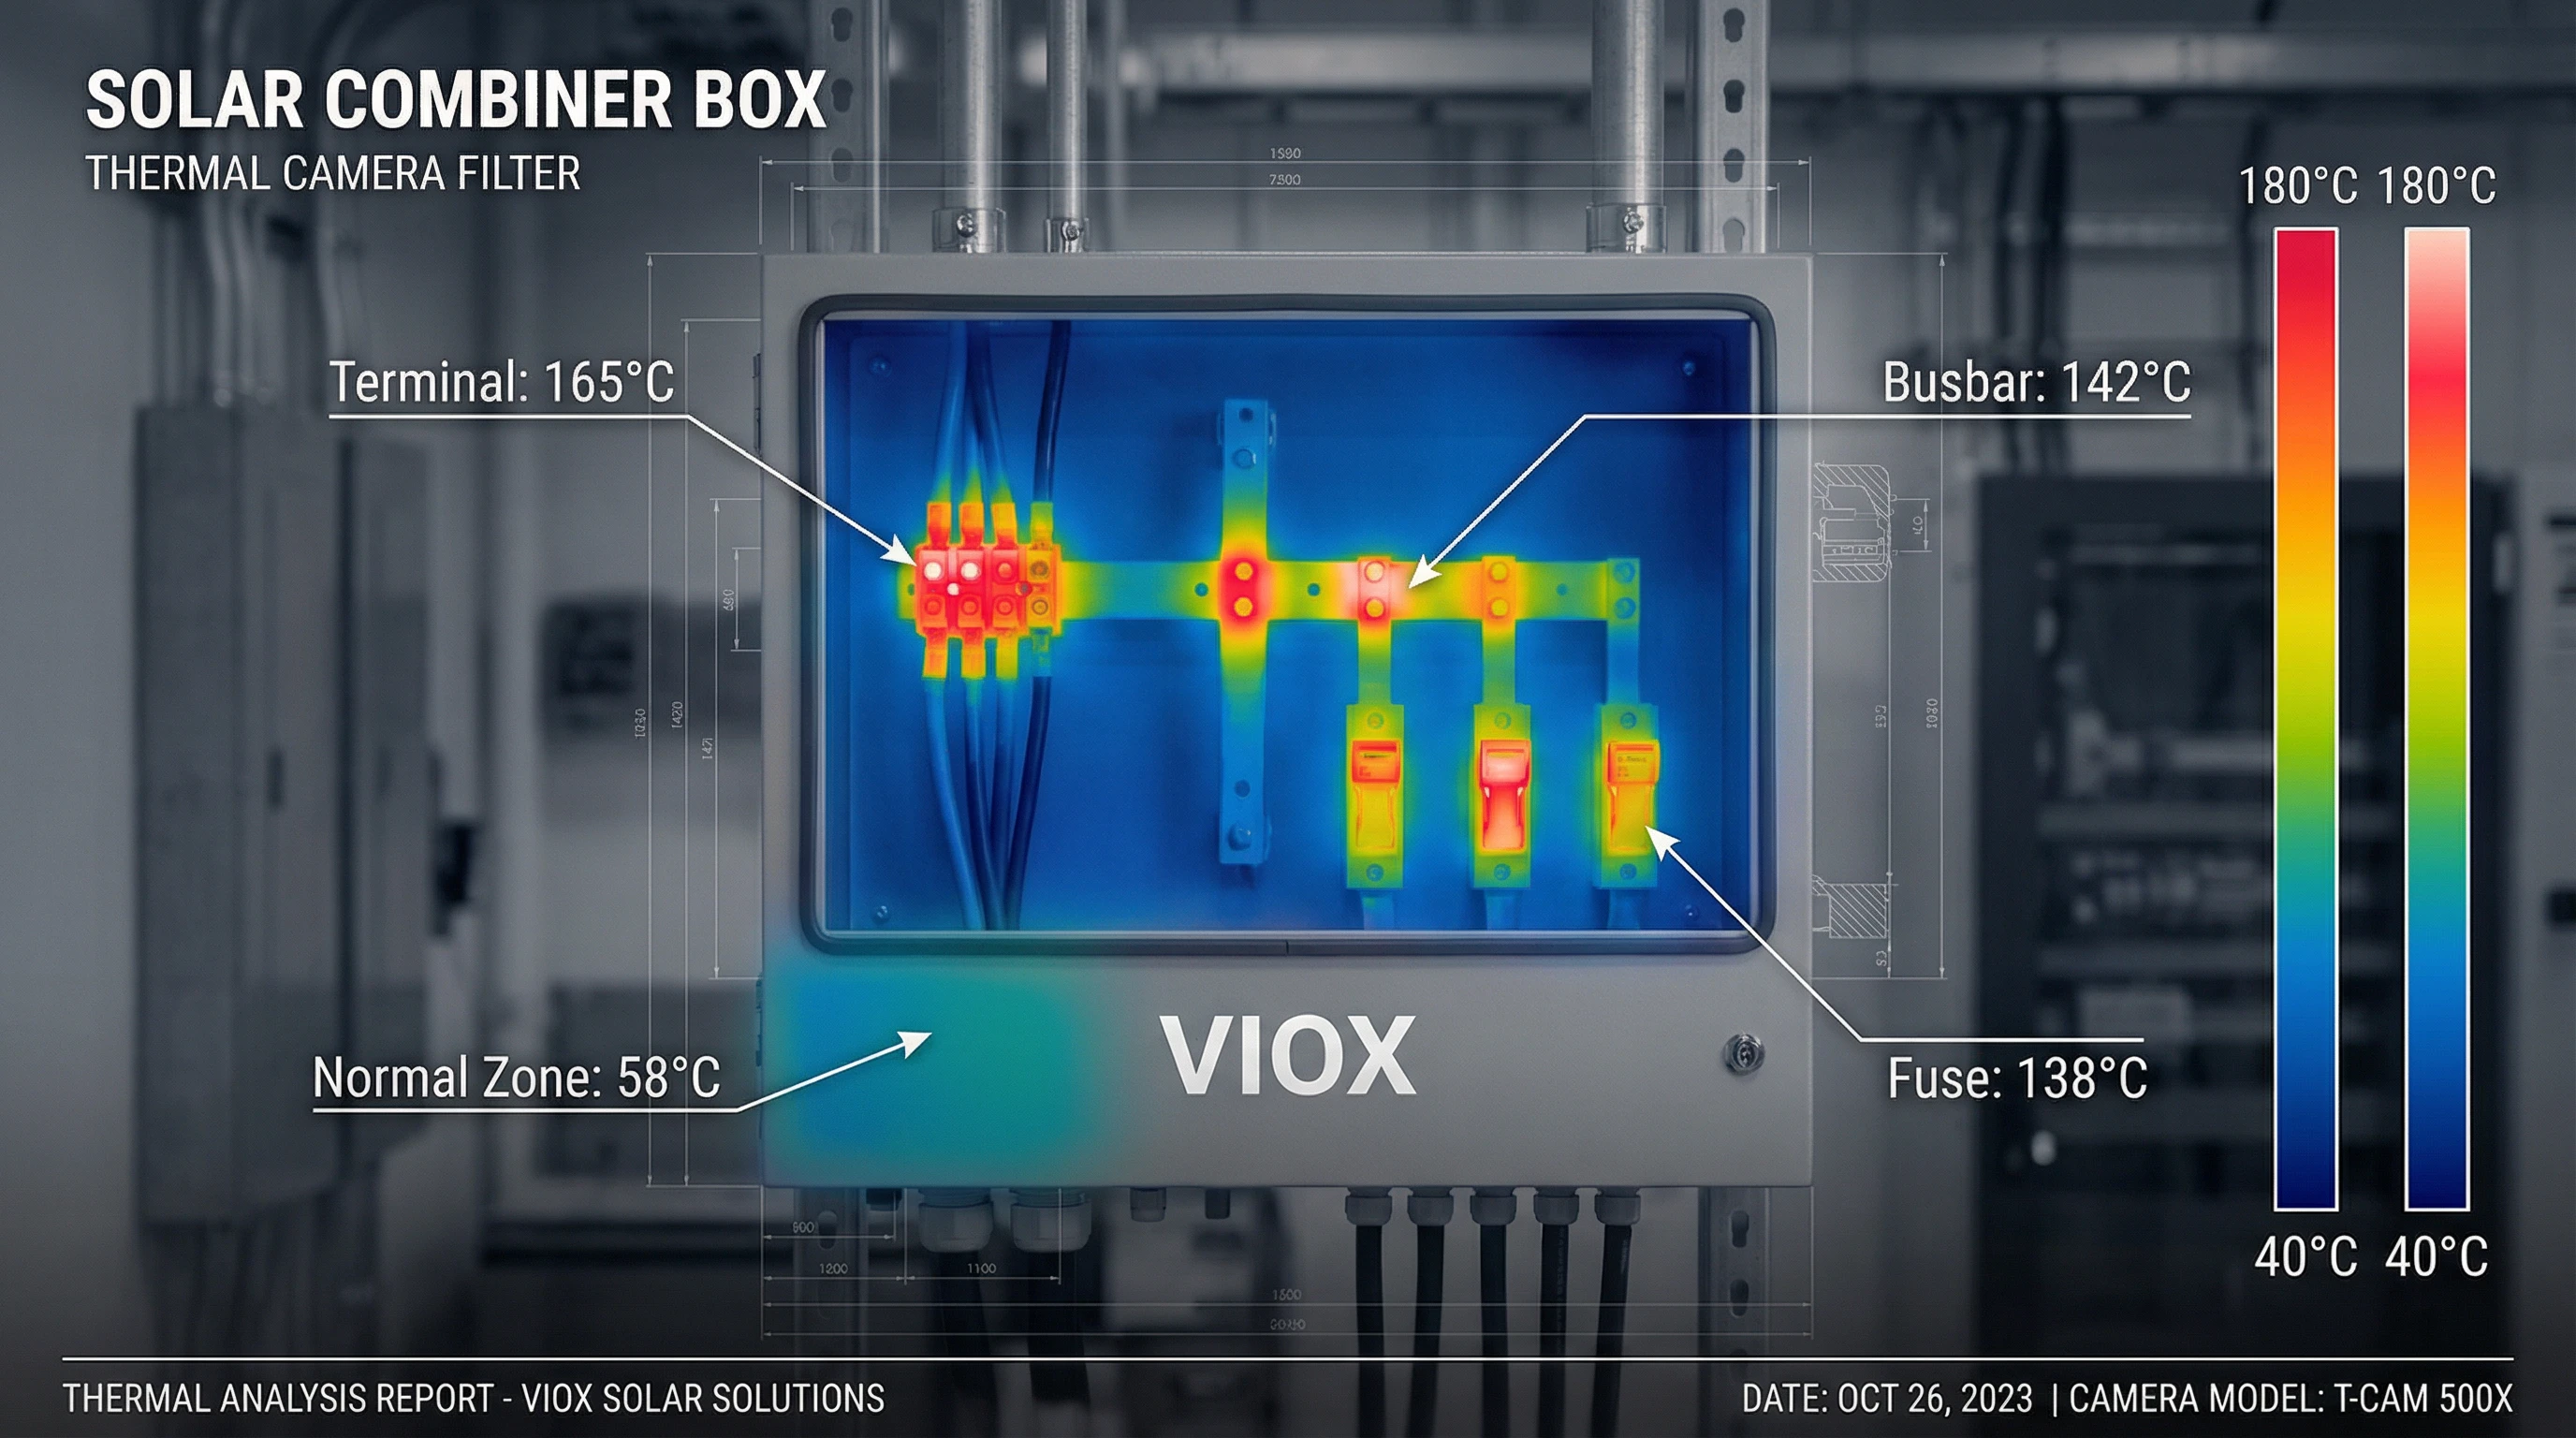
Connector, junction box, and combiner overheating
Electrical connection points are common failure locations in PV assets. Loose MC4 connectors, corroded terminals, degraded junction boxes, and aging fuses can create resistance that produces heat. Unlike many cell-level inefficiencies, connection overheating can carry meaningful safety implications because it concentrates heat at points where materials and insulation can degrade quickly.
In practice, thermal inspections often highlight these high-risk points as localized elevated temperatures at connectors, combiner enclosures, or inverter inputs. When identified early, corrective action may be as simple as re-termination or component replacement. When ignored, these anomalies can lead to forced downtime, costly repairs, and avoidable insurance exposure.


Soiling, shading, and environmental effects that mimic defects
Not every thermal abnormality indicates an electrical component failure. Uneven soiling, debris, bird droppings, pollen buildup, and vegetation encroachment can create current mismatch that presents as elevated temperature patterns. Shading from nearby structures or tracker misalignment can do the same. These effects still cost money because they reduce yield, but the corrective action differs from module replacement or electrical repair.
Drone-based thermal mapping is useful here because it shows where cleaning and vegetation management will restore production most efficiently. Instead of applying uniform maintenance across an entire site, operators can target the zones that produce measurable mismatch and heat.
The financial cost of leaving anomalies unchecked
Solar assets produce revenue through kilowatt-hour output. When defects persist, they create a quiet, compounding loss that can run for months between service events. A small loss per module becomes a large loss at scale. Even a low percentage of underperforming modules in a multi-megawatt system can translate into substantial annual revenue erosion depending on energy pricing and production targets.
Beyond pure yield loss, anomalies introduce secondary costs. Sustained mismatch can stress inverters and increase thermal cycling. Connection heating can trigger safety responses and downtime. Deferred defects can complicate warranty claims because the longer the time window between detection and documentation, the harder it becomes to prove when a defect began and how it progressed.
Thermal inspections convert those invisible losses into measurable evidence. They create a clear maintenance priority list that reduces the chance that high-severity issues remain active in the field for long periods.
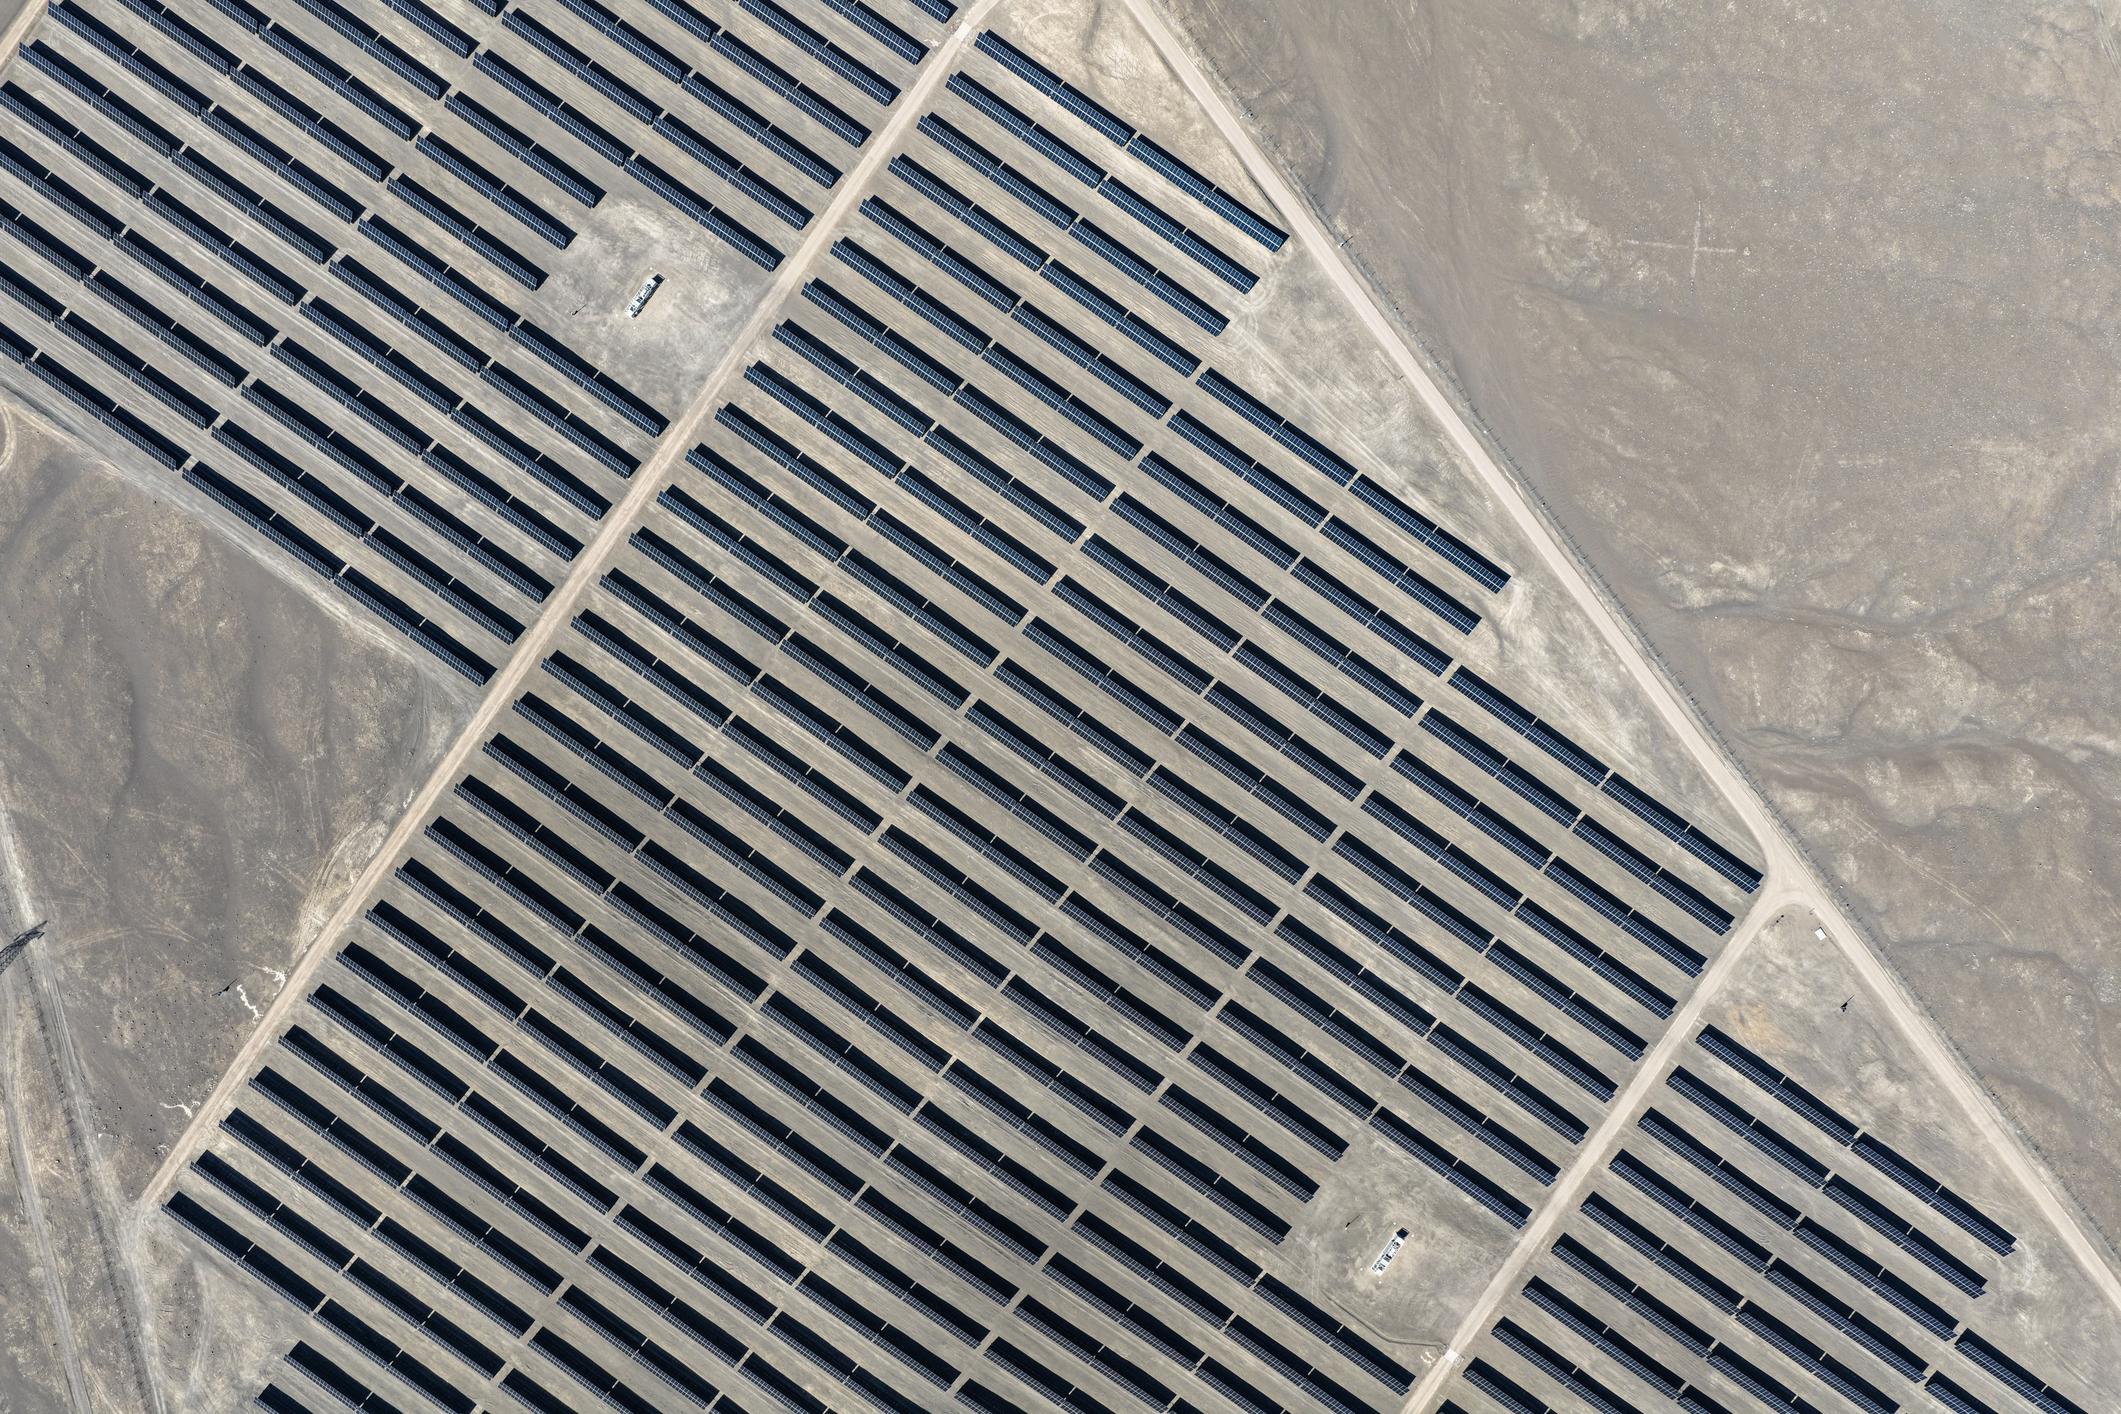
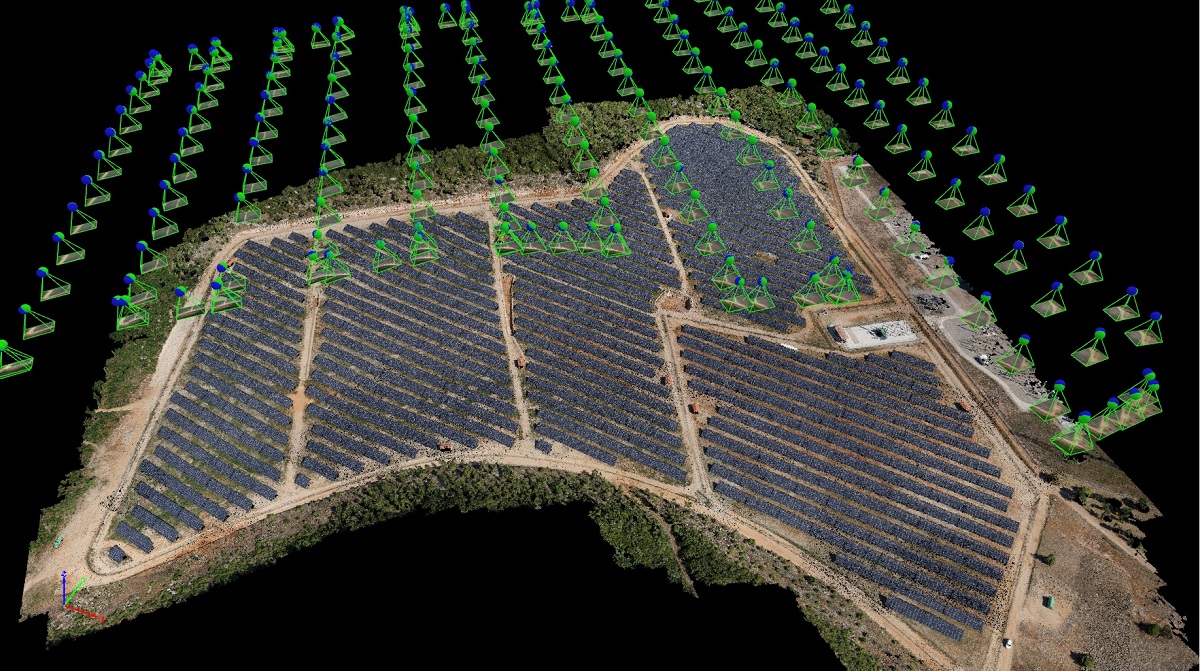
Structured drone-based inspection workflow
Handheld inspections struggle with scale. Utility sites can contain tens of thousands of modules across hundreds of acres. Drone-based inspection solves that by capturing consistent coverage quickly, using repeatable flight plans. A structured workflow typically begins with timing and environment verification so the array is under adequate load. Automated grid missions then capture synchronized RGB and thermal imagery with consistent overlap, altitude, and speed.
After capture, imagery is processed and organized into deliverables that match how maintenance teams work. The output is not just a folder of images. The output is a site-wide dataset with context and traceability, designed to be actionable in the field.
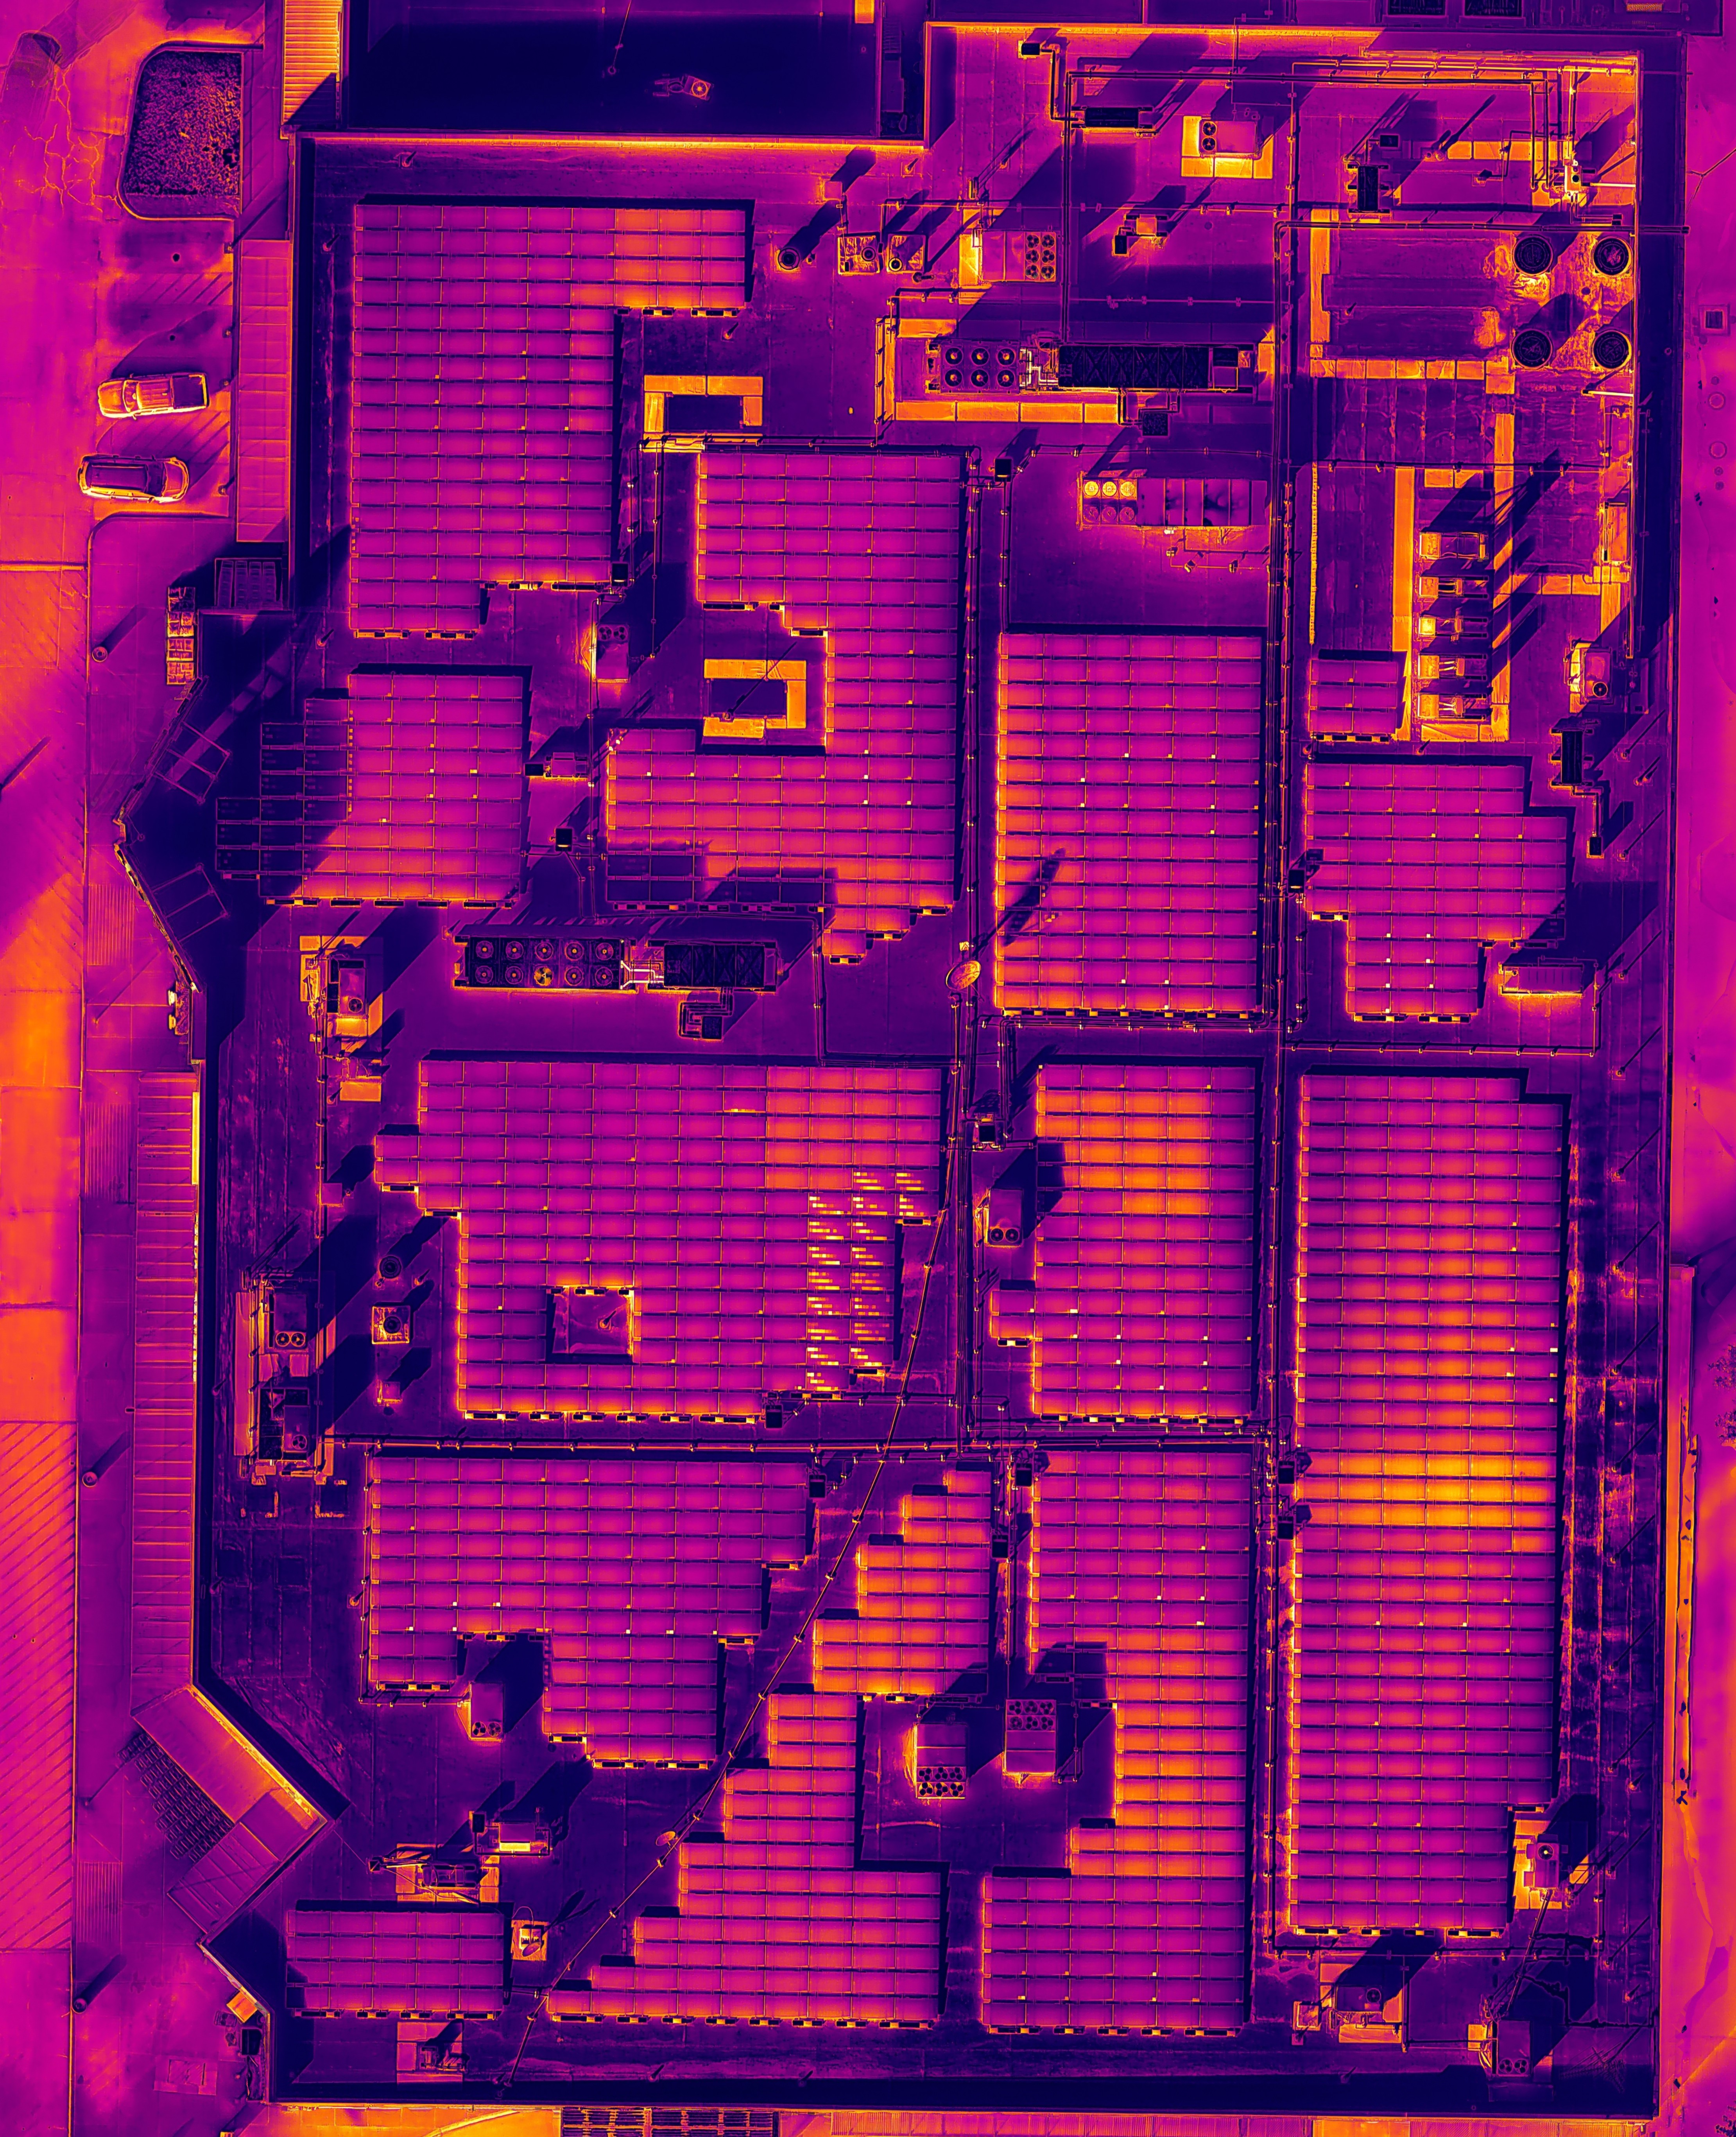
Thermal mapping and orthomosaic intelligence
Raw thermal images alone do not create operational value. The real power of drone-based inspections lies in structured thermal mapping. After flight capture, thermal imagery is stitched into a geo-referenced orthomosaic. This creates a spatially accurate thermal map of the entire site, allowing anomalies to be viewed in context rather than in isolation. Every module can be measured, compared, and documented under the same irradiance conditions.
Instead of reviewing individual images one by one, stakeholders receive a full-site temperature dataset. Outliers become visible immediately. Patterns emerge across strings, inverter blocks, and structural zones. Maintenance becomes faster because the inspection product is already organized around location and severity, not just images.
This mapping approach enables precise GPS-based module identification, severity classification based on temperature spread, cluster detection across inverter groups, historical comparison across inspection cycles, and defensible documentation for maintenance records. Thermal mapping transforms inspection from a visual exercise into a measurable, repeatable asset management process.
Temperature spread as a prioritization metric
In practice, severity prioritization often relies on temperature spread, the difference between the warmest and coolest comparable modules operating under identical conditions. A module temperature value alone can be misleading because ambient conditions shift baseline temperature. What matters is the outlier behavior relative to its neighbors in the same operating block.
For example, a module reading 49.5°C may not sound alarming until you compare it to surrounding modules reading 31.9°C under the same irradiance. That spread indicates abnormal resistance and a likely efficiency penalty. Prioritizing by spread is a practical way to direct limited maintenance labor toward defects with the highest probability of meaningful production loss or safety risk.
For real-world examples of how anomaly types and severity logic are documented, see the thermal case studies here: https://sterflies.com/thermal/case-studies
Post-repair verification and why re-inspection matters
Detection is only the first step. A professional inspection workflow includes post-repair verification. After maintenance teams replace modules, re-terminate connectors, or correct electrical issues, a follow-up drone inspection confirms that temperature differentials have normalized under similar operating conditions. This closes the loop between finding a problem and proving it was fixed.
Verification provides defensible documentation for asset owners, insurers, and warranty providers. It reduces uncertainty, supports performance reporting, and prevents unresolved defects from lingering unnoticed after a repair cycle.
Case study demo: large-scale anomaly mapping
A practical example of large-scale anomaly mapping can be reviewed here: https://sterflies.com/projects/pv-farm-hotspots. This demo project demonstrates systematic site coverage, high-density anomaly identification, and reporting methodology that scales across real-world PV facilities.
Final perspective: thermal inspections as revenue protection
Solar arrays are financial assets designed to produce predictable yield over decades. The gap between expected ROI and realized ROI often comes down to how quickly issues are detected and how consistently corrective work is verified. Hotspots, diode failures, string imbalance, connection heating, and soiling all create measurable loss. The only question is how long those conditions remain active before someone sees them.
Drone-based thermal inspections provide speed, repeatability, and full-site perspective. Thermal mapping converts imagery into geo-referenced datasets. Temperature spread classification prioritizes repairs objectively. Post-repair verification confirms restoration rather than assuming it. Together, these steps turn inspection into asset management infrastructure.
Solar performance is measurable. Electrical resistance produces heat. Heat reveals inefficiency. Early detection protects revenue. The difference lies in inspection methodology and repeatable verification.
References
- IEC 62446-3. Photovoltaic (PV) systems requirements for testing, documentation and maintenance – Part 3: Photovoltaic modules and plants – Outdoor infrared thermography. https://webstore.iec.ch/en/publication/28628
- IEA PVPS. Publications on PV performance, degradation mechanisms, and operational best practices. https://iea-pvps.org/publications/
- Roof PV System Case Study DEMO (anomaly types + severity logic examples). https://sterflies.com/thermal/case-studies
Need a structured solar thermal inspection with mapping and verification
SterFlies supports solar stakeholders with drone-based thermal mapping, geo-referenced anomaly reporting, and post-repair verification flights. When production, warranty protection, and risk management matter, inspection should be repeatable and measurable.